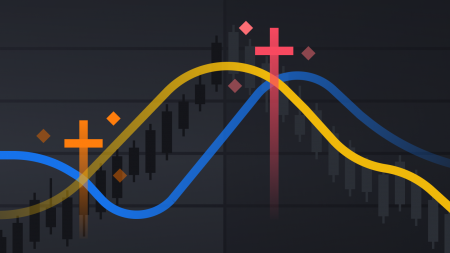
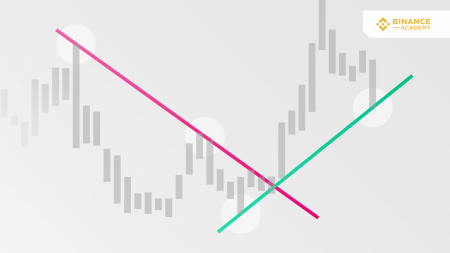
Golden Cross and Death Cross Explained
Introduction
Chart patterns are abundant when it comes to technical analysis. We have already talked about them in A Beginners Guide to Classical Chart Patterns, and 12 Popular ...
The Ultimate Guide to Trading on Binance Futures
Contents
How to open a Binance Futures account
How to fund your Binance Futures account
Binance Futures interface guide
How to adjust your leverage
What is the differ...
What Is a Trading Journal and How to Use One
Trading journals can be very useful, and they play a central role in the trading plans of most professional traders. Things like planning futures trades, documenting existing posit...
How to Read “one-candle signals” of Candlestick Charts
Wondering what cryptocurrencies to buy, and when? When you research crypto assets, you may run into a special type of price graph called a candlestick chart. So it’s good to take a little time to learn how these work.
Similar to more familiar line and bar graphs, candlesticks show time across the horizontal axis, and price data on the vertical axis. But unlike simpler graphs, candlesticks have more information. In one glance, you can see the highest and lowest price that an asset hit during a given timeframe — as well as its opening and closing prices.
Bollinger Bands Explained
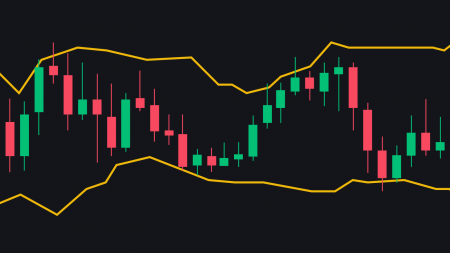
What are the Bollinger Bands?
The Bollinger Bands (BB) were created in the early 1980s by financial analyst and trader John Bollinger. They are broadly used as an instrument for...
Binance Options Guide for iOS and Android
Introduction
Binance is eager to bring you the widest range of products that you can use to take part in the crypto revolution. You could choose to trade on the spot exchange, m...
Trend Lines Explained
What are trend lines?
In financial markets, trend lines are diagonal lines drawn on charts. They connect specific data points, making it easier for chartists and traders to visu...
Understanding the Different Order Types
When youre trading stocks or cryptocurrency, you interact with the market by placing orders:
A market order is an instruction to buy or sell immediately (at the markets cu...
A Simple Introduction to Dark Pools
What is a dark pool?
A dark pool is a private venue facilitating the exchange of financial instruments. It differs from a public exchange in that there is no visible order book,...
How to Calculate Return on Investment (ROI)
ROI is a way to measure an investments performance. As youd expect, its also a great way to compare the profitability of different investments. Naturally, an investment with a high...
12 Popular Candlestick Patterns Used in Technical Analysis
Contents
Introduction
How to use candlestick patterns
Bullish reversal patterns
Hammer
Inverted hammer
Three white soldiers
Bullish harami
Bearis...
What Is an OCO Order?
Note: We highly recommend reading our guides on limit and stop-limit orders prior to continuing.
An OCO, or One Cancels the Other order allows you to place two orders at the...
