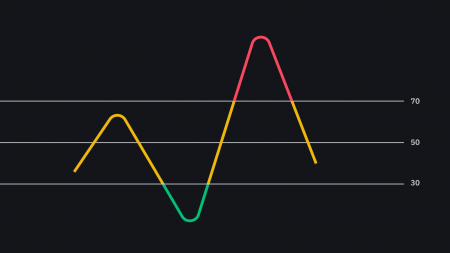
What Is the RSI Indicator?
The Relative Strength Index Indicator
Technical analysis (TA) is, essentially, the practice of examining previous market events as a way to try and predict future trends and pri...
Black Monday and Stock Market Crashes Explained
What is Black Monday?
Black Monday is the name used to describe a sudden and severe stock market crash that occurred on October 19th, 1987. The Dow Jones Industrial Average (DJI...
Who got in Crypto when Bitcoin was $10
We asked crypto influencers, veteran traders, VC fund founders, and more to share their top tips, essential Twitter follows, and the stories behind their best trades ever. In this edition we speak to longtime trader Ray Tong, who is full of practical advice for both new and experienced investors.
Ray Tong stumbled across Bitcoin before most people had even heard of it, while working on a college project in 2011. He got his first bitcoin for when they were just $10, which required a trip to Walgreens to send a Western Union payment to a stranger on the other side of the planet. (Thankfully it’s gotten a lot easier.) When Bitcoin’s price quickly shot up to $30, he was hooked. He got deeper into trading during his post-college years working at Facebook, where he was an active member of a popular internal crypto channel. These days he splits his life between his day job – he’s a product manager at the online fashion site Farfetch, where he builds internal tools that have nothing to do with crypto – and managing his cryptocurrency portfolio. He’s full of practical, everyday advice for both new and experienced traders.
How to Read “one-candle signals” of Candlestick Charts
Wondering what cryptocurrencies to buy, and when? When you research crypto assets, you may run into a special type of price graph called a candlestick chart. So it’s good to take a little time to learn how these work.
Similar to more familiar line and bar graphs, candlesticks show time across the horizontal axis, and price data on the vertical axis. But unlike simpler graphs, candlesticks have more information. In one glance, you can see the highest and lowest price that an asset hit during a given timeframe — as well as its opening and closing prices.
A Simple Introduction to Dark Pools
What is a dark pool?
A dark pool is a private venue facilitating the exchange of financial instruments. It differs from a public exchange in that there is no visible order book,...
How to Calculate Position Size in Trading
Introduction
No matter how big your portfolio is, youll need to exercise proper risk management. Otherwise, you may quickly blow up your account and suffer considerable losses. ...
Trend Lines Explained
What are trend lines?
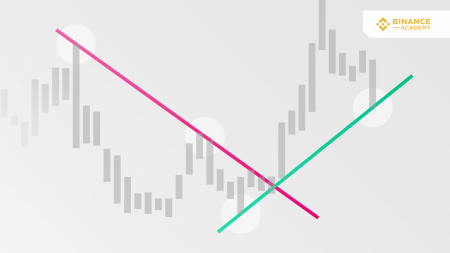
In financial markets, trend lines are diagonal lines drawn on charts. They connect specific data points, making it easier for chartists and traders to visu...


