Stochastic RSI Explained
What is Stochastic RSI?
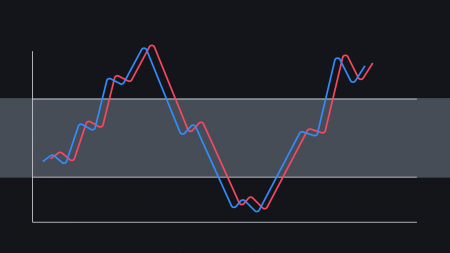
Stochastic RSI, or simply StochRSI, is a technical analysis indicator used to determine whether an asset is overbought or oversold, as well as to identif...
What Is Technical Analysis?
Technical analysis (TA), often referred to as charting, is a type of analysis that aims to predict future market behavior based on previous price action and volume data. The TA app...
MACD Indicator Explained
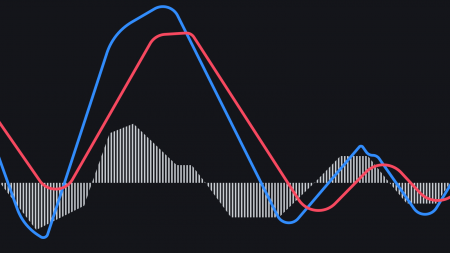
The Moving Average Convergence Divergence (MACD) is an oscillator-type indicator that is widely used by traders for technical analysis (TA). MACD is a trend-following tool that uti...
What Are Forward and Futures Contracts?
Essentially, forward and futures contracts are agreements that allow traders, investors, and commodity producers to speculate on the future price of an asset. These contracts funct...
What Is Margin Trading?
Margin trading is a method of trading assets using funds provided by a third party. When compared to regular trading accounts, margin accounts allow traders to access greater sums ...
What Are Options Contracts?
An options contract is an agreement that gives a trader the right to buy or sell an asset at a predetermined price, either before or at a certain date. Although it may sound simila...
Ichimoku Clouds Explained
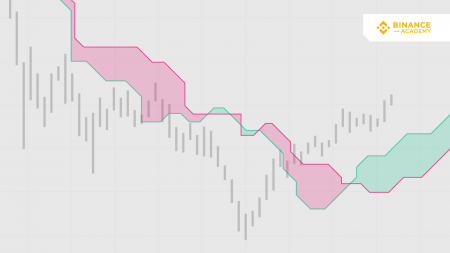
The Ichimoku Cloud is a method for technical analysis that combines multiple indicators in a single chart. It is used on candlestick charts as a trading tool that provides insights...
Binance Margin Trading Guide
How to open a Margin Trading account on Binance
After logging in to your Binance account, move your mouse to the top right corner to and hover over your profile icon. This will ...
What Are Perpetual Futures Contracts?
What is a futures contract?
A futures contract is an agreement to buy or sell a commodity, currency, or another instrument at a predetermined price at a specified time in the fu...
What Is an OCO Order?
Note: We highly recommend reading our guides on limit and stop-limit orders prior to continuing.
An OCO, or One Cancels the Other order allows you to place two orders at the...
Trend Lines Explained
What are trend lines?
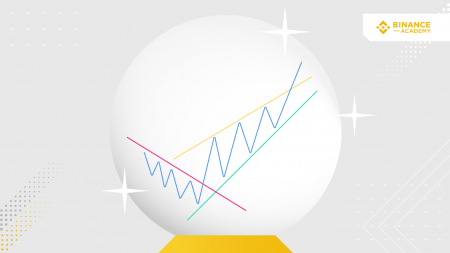
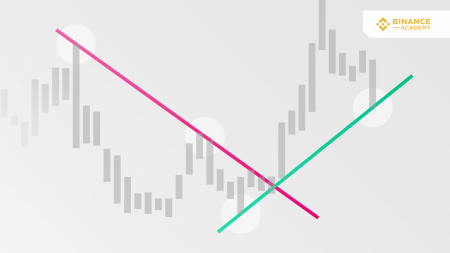
In financial markets, trend lines are diagonal lines drawn on charts. They connect specific data points, making it easier for chartists and traders to visu...
Leading and Lagging Indicators Explained
What are leading and lagging indicators?
Leading and lagging indicators are tools that evaluate the strength or weakness of economies or financial markets. Simply put, leading i...
